
Triassic
The first dinosaurs emerged as life recovered from the largest mass extinction in Earth history.
- Range
- 251.902–201.4 Ma
- Mapped sites
- 449
- Occurrences
- 602
Deep time · Field map 01
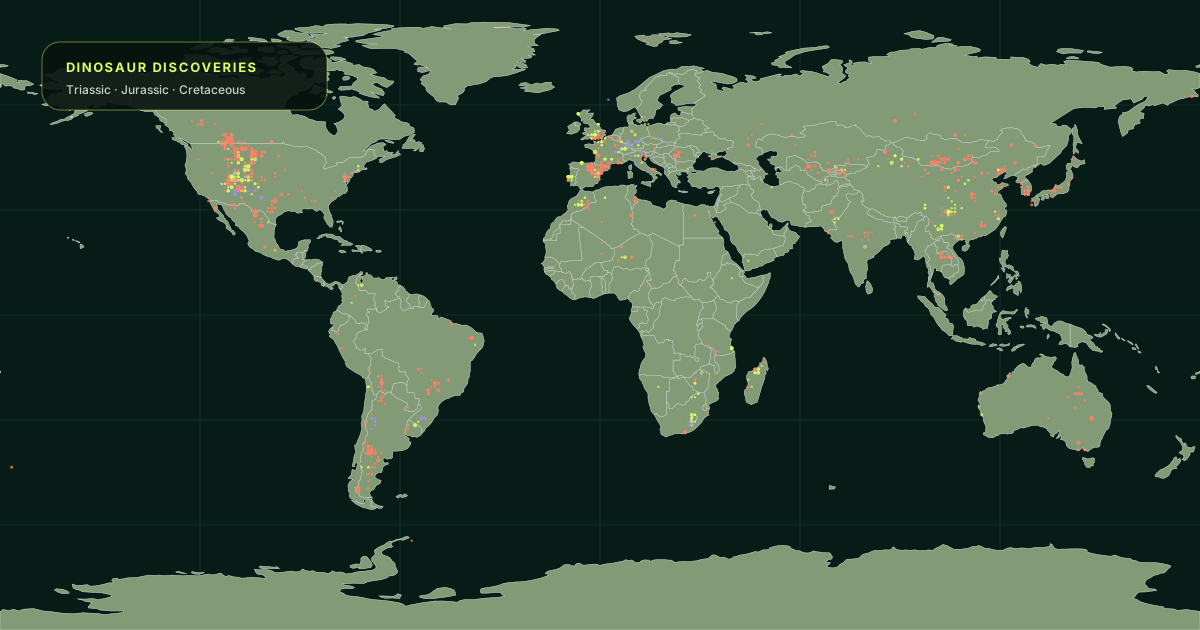
See where dinosaur fossils were discovered—and travel through the Triassic, Jurassic and Cretaceous without leaving the map.
This is a map of evidence, not a guess at population density. Every light begins with a published occurrence in the Paleobiology Database.
The fossil record, spatialized
Search a taxon, isolate a period or scrub to one moment in deep time. Select any point to inspect its age, formation, environment and recorded dinosaurs.
186 million years
The map colors each collection by the midpoint of its estimated age range. Boundaries are useful conventions, not hard switches in the history of life.
The first dinosaurs emerged as life recovered from the largest mass extinction in Earth history.
Sauropods, stegosaurs and large theropods spread across fragmenting Pangaea.
Flowering plants diversified while hadrosaurs, ceratopsians and tyrannosaurs reshaped terrestrial ecosystems.
The mapped point is a one-degree generalization of the modern place attached to a fossil collection. Continents moved, shorelines changed and remains could be transported before burial. The location is real evidence, but its meaning needs geological context.
Most occurrences are assigned to an interval rather than a single year. The moment filter includes a site when the selected age falls inside that reported range. 11 broad source ranges cross the map’s 251.9–66 Ma display window and are transparently clipped at its boundary.
Outcrop exposure, road cuts, quarries, research traditions and database coverage shape the visible pattern. Use density to find well-documented parts of the fossil record—not to rank ancient abundance.
The map uses PBDB’s accepted taxon at snapshot time. New papers can split, merge or reassign a fossil. Search results therefore represent a versioned scientific record, not a permanent final taxonomy.
Coverage, not abundance
These totals describe entries in this PBDB snapshot. They primarily reveal where fossil-bearing rocks and sustained research overlap.
| Present-day country | Sites | Occurrences |
|---|---|---|
| United States of America | 2,767 | 5,451 |
| Canada | 846 | 1,759 |
| Spain | 730 | 1,362 |
| People's Republic of China | 768 | 1,305 |
| Mongolia | 329 | 806 |
| Argentina | 377 | 678 |
| United Kingdom | 445 | 661 |
| France | 288 | 498 |
| Brazil | 239 | 494 |
| Australia | 193 | 366 |
This edition uses PBDB’s pres=regular scope, so trace, footprint, egg and other form-taxon records are excluded from these totals.
Provenance before spectacle
A living scientific database deserves a frozen, inspectable edition. The browser never calls PBDB on your behalf.
Published regular occurrences for Dinosauria (52775), excluding Aves (36616), within PBDB’s Mesozoic interval using timerule=major.
18,255 source occurrences retrieved through Data Service 1.2 on 2026-08-10. The raw response is pinned locally by SHA-256.
Records sharing a PBDB collection number become one site. Taxa and occurrence counts remain attached to that collection.
Every modern location is generalized to the centre of a one-degree grid cell. Exact coordinates, paleocoordinates, protection flags, locality comments and county fields stay out of the browser asset.
Duplicate occurrence IDs, invalid coordinates, impossible ages, collection-coordinate conflicts and output checksums fail the build.
PBDB’s API response is CC0. The Atlas transformation and presentation are CC BY 4.0. Natural Earth supplies the modern boundary context and remains attributed separately.
ce9afd5d04608353598f101178f0b0cad399588a5d06f274d6bd05a94d5377442ff178e460341cda95b5bf33d5ca518dcd3e4c9e2a0e2cd76844429245a2af90Field notes
It shows generalized present-day locations for fossil collections recorded by the Paleobiology Database. A discovery location is evidence that a dinosaur lived in the wider ancient region, but it is not a precise map of an animal’s home range.
The pattern combines geology with human activity. Exposed sedimentary rocks, research history, funding, access and publication practices all influence which fossils enter the database. Dense clusters must not be read as dinosaur population density.
Ma means mega-annum: one million years ago. A site labeled 150–145 Ma has an estimated age range between 150 million and 145 million years ago.
The snapshot queries Dinosauria while excluding records classified by PBDB under the child taxon Aves. Stem birds and taxonomically unresolved records can still appear because paleontological classifications and identifications change over time.
No. Locations are deliberately generalized to one-degree grid cells and are presented for research and education, not collecting. Fossils may be protected by land ownership, conservation rules and national or local law. Never enter a site or remove material without explicit permission.
This edition uses a versioned PBDB snapshot retrieved on August 10, 2026. The source response and browser asset have SHA-256 checksums so the map can be reproduced and audited.